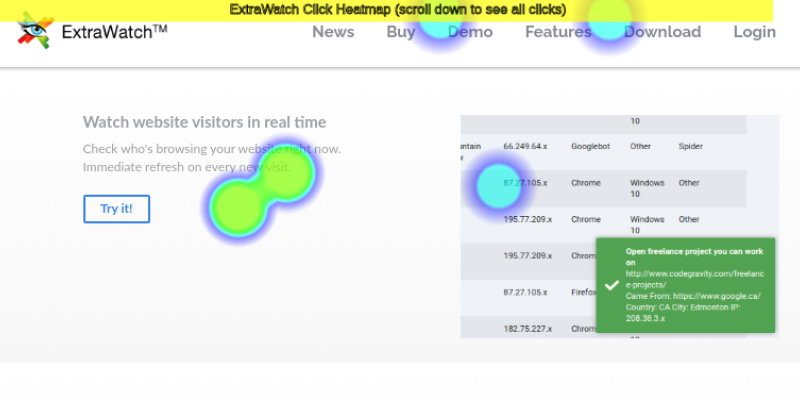
Click heat map allows you to see your visitors interactions with your website which of the elements of your website are the most active.
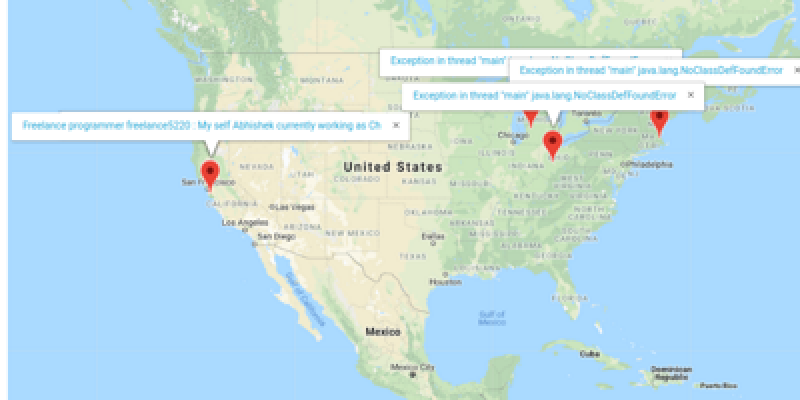
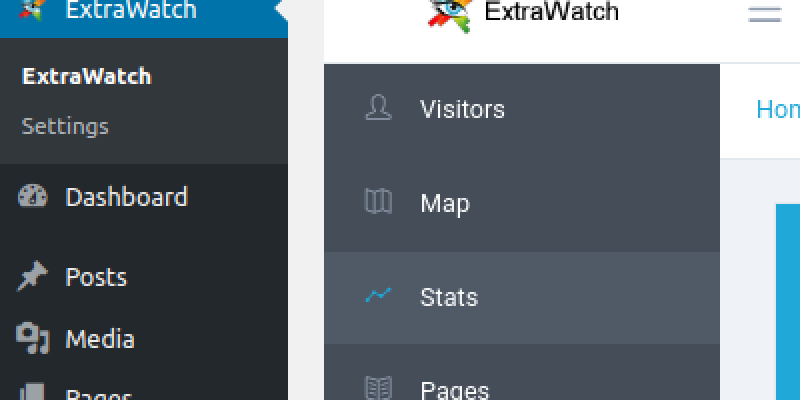
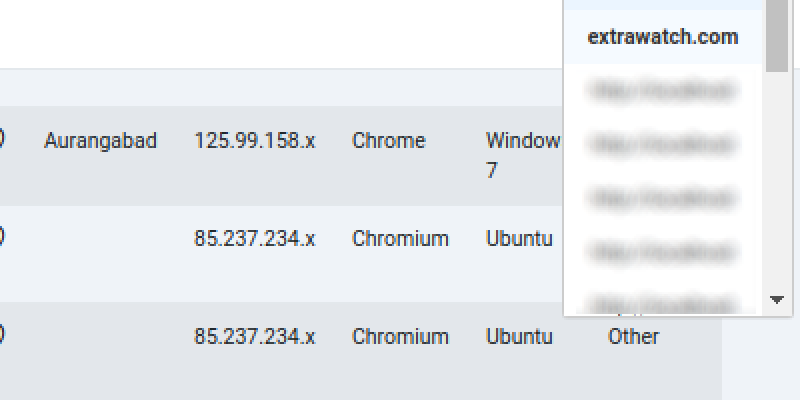
"Map" menu item opens a world map with locations where your users are you coming from. Each visit has a title which website page has the user visited.
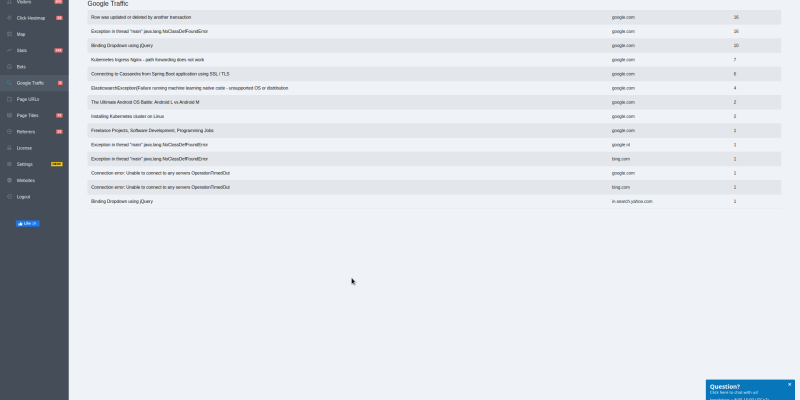
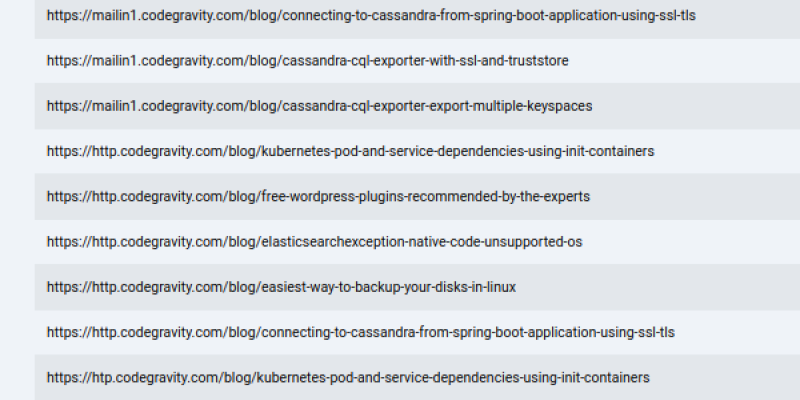
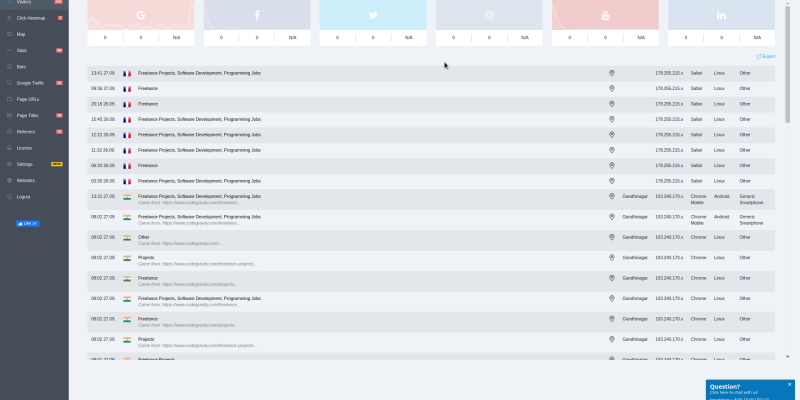
Google traffic section is very important if you have your website indexed by Google. It shows you "landing pages" of visits from google.

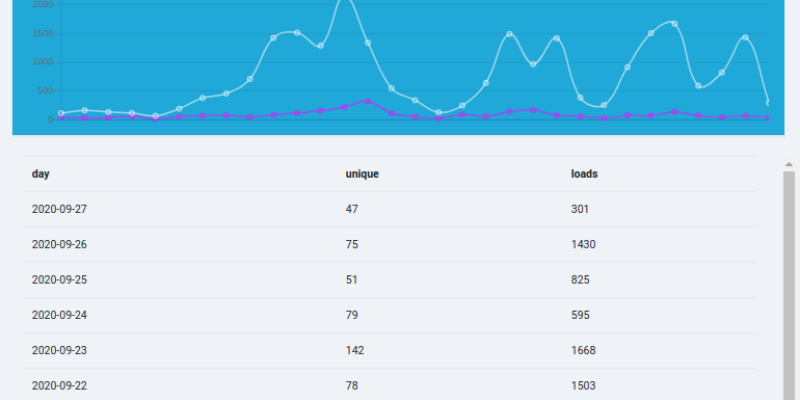
Charts representing number of users from Google, Facebook, Twitter, Instagram, YouTube and Linkedin
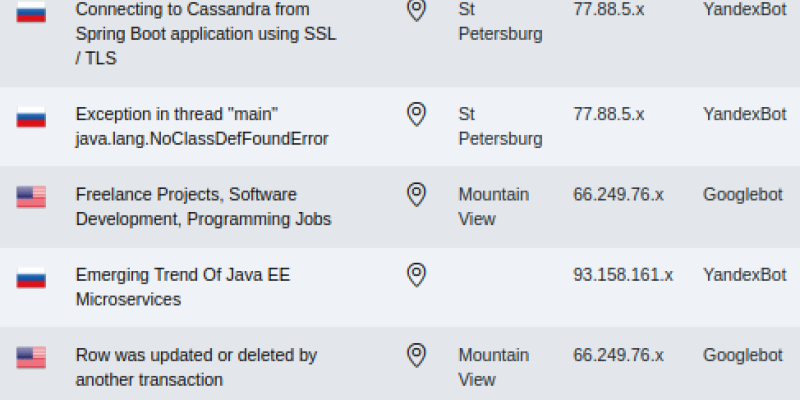
Bots